Monitoring Transcribe and Translate Jobs in the Process App
MediaCentral Cloud UX offers process monitoring features in the Process app. You can monitor the jobs you initiated when triggering transcript or translation creation and jobs of involved components. When signed into MediaCentral Cloud UX as a standard user, you are allowed to see only the jobs that you submitted. If an administrator enables the Master of Jobs entitlement for a user group, the users within that group can see the list of jobs submitted by all users.
By default, jobs of all types currently being used are shown as a list in the Process app that is sorted by the Name column in alphabetical order. You can modify the Process List to show only Transcribe and Translate jobs by using the following controls:
|
Control |
Action |
|---|---|
|
Groups filter (sidebar) |
The following Groups filters can be used for monitoring Transcribe jobs:
The following Groups filter can be used for monitoring Translate jobs:
|
|
System filter (sidebar) |
The following System filters can be used for monitoring Transcribe jobs:
n The filters Unknown and XForm will also show jobs that are not related to Transcribe. The following System filter can be used for monitoring Translate jobs:
|
|
Show Hierarchy toggle (toolbar) |
To visualize the hierarchy of the jobs involved in the transcript or translation creation, select the Show Hierarchy toggle button in the toolbar. All jobs involved in the process chain for one transcript or translation are shown as sub-jobs of a top-level Media Analytics job. Each top-level Media Analytics job shows the name of the asset for which the transcript or translation is currently being created and a prefix. For Transcribe jobs, the prefix is:
For Translate jobs, the prefix is:
|
All filters are cumulative. The best approach to display Transcribe and Translate jobs in the Process app is to use the Groups filter and Show Hierarchy toggle, as described in the following procedure.
n As a standard user, you only see the “Group” STT@Avid DP ML and “System” Media Analytics in the Process app for the transcribe jobs you triggered in the Transcript tab. Only users of a group with Master of Jobs entitlement can see the all included groups and jobs.
To monitor Transcribe and Translate jobs in the Process app:
-
 Click the Process button on the Fast Bar.
 -
Open the Filters sidebar.
-
To show only transcribe jobs using "Groups":
-
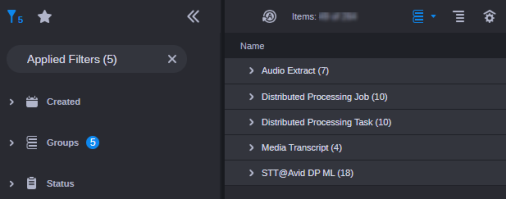
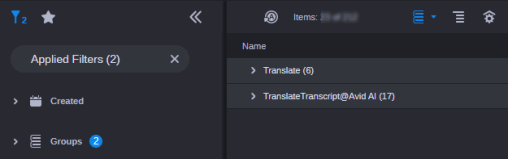
Expand the Groups list in the Filters sidebar.
-
Click the "show all" button.
-
In the break-out window that opens. select the process groups you want to display and then click the Apply button.
-
For Transcribe: Audio Extract, Distributed Processing Job, Distributed Processing Task, Media Transcript, STT@Avid DP ML
-
For Translate: TranslateTranscript@Avid AI and Translate
-
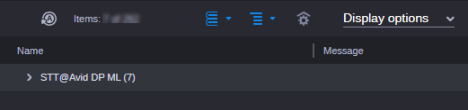
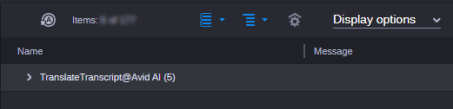
The Process app shows you only the corresponding jobs. Example for transcribe jobs:
Example for translate jobs:
-
-
To define the grouping behavior:
-
 Click the Display Group button so it turns blue.
Jobs are grouped by the group property in the Process List.
Example for transcribe groups:
Example for translate groups:
-
Click the Expand/Collapse toggle button of each job group to show its jobs.
-
-
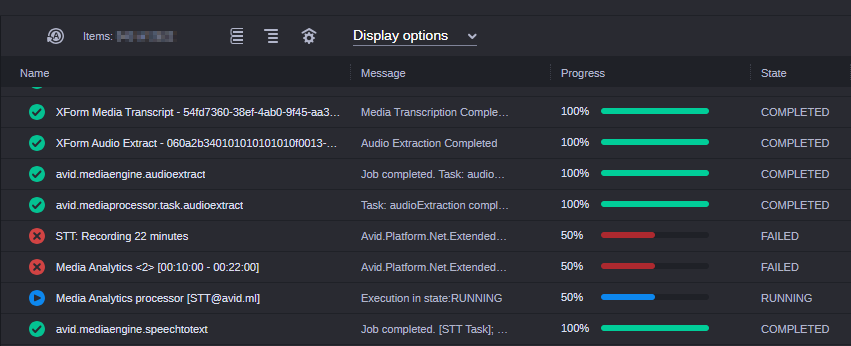
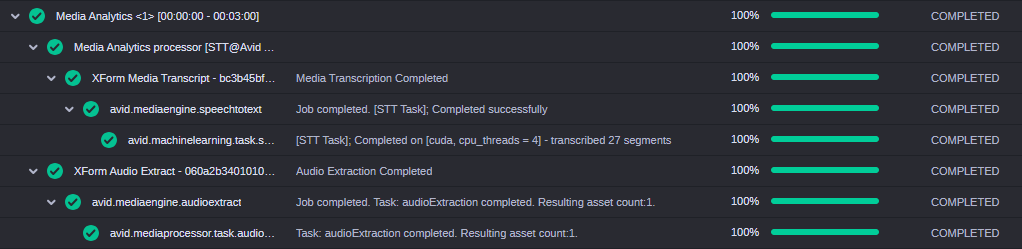
To visualize the job hierarchy for Transcribe:
-
 Click the Show Hierarchy button in the Process app toolbar so it turns blue.
Sub-jobs are arranged below their parent job in the Process List.
Since the Groups filter is still applied and Transcribe jobs are parent jobs, the names of the other involved Groups are no longer shown.
-
Click the Expand button to the left side of the STT@Avid DP ML group header to show all top-level Transcribe jobs.
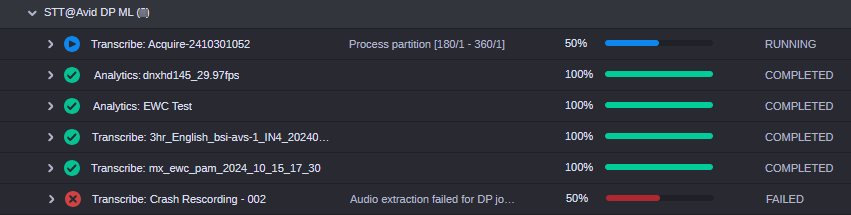
Each top-level Transcribe job shows the name of the asset for which the transcript is currently being created and a prefix (such as Transcribe or Avid DP ML Transcribe) in its name.
-
Click the Expand / Collapse toggle button in front of a top-level Transcribe job to show or hide its sub-jobs.
On the second hierarchy level, a Media Analytics<number> job for each partition is shown.
-
For EWC clips, the partition size is 3 minutes.
-
For non-growing clips, the partition size is 1 hour.
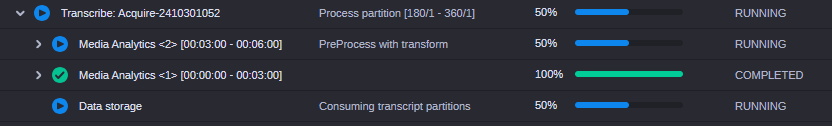
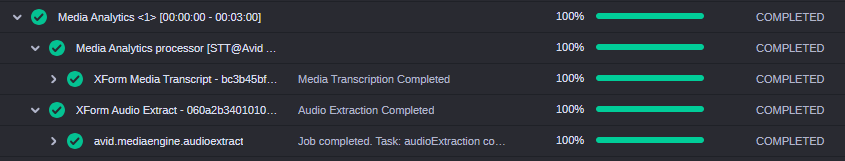
Below each Media Analytics partition job, the involved Audio Extract, Media Transform, Distributed Processing Job and Distributed Processing Task jobs are shown.
-
-
Click the Expand / Collapse toggle button in front of a parent job to show or hide its sub-jobs.
-
-
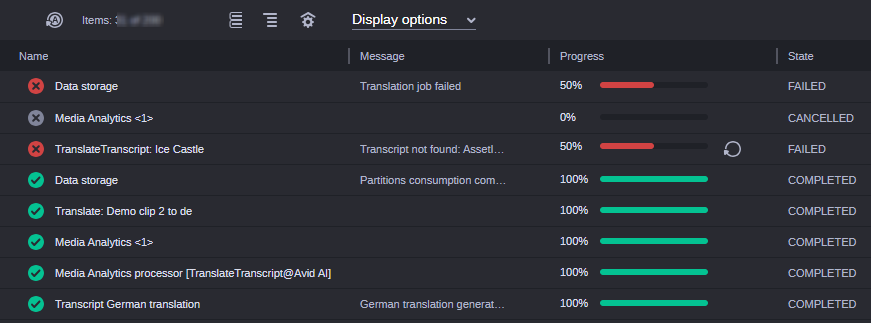
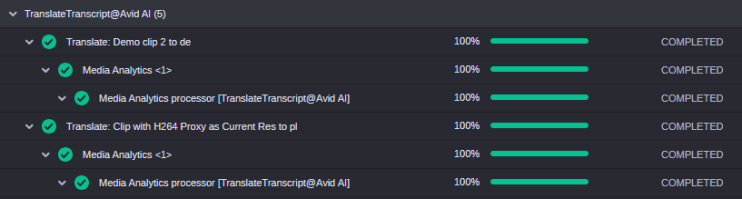
To visualize the job hierarchy for Translate:
-
Click the Show Hierarchy button in the Process app toolbar so it turns blue.
Sub-jobs are arranged below their parent job in the Process List.
Since the Groups filter is still applied and Translate jobs are parent jobs, the names of the other involved Groups are no longer shown.
-
Click the Expand button to the left side of the TranslateTranscript group header to show all top-level Translate jobs.
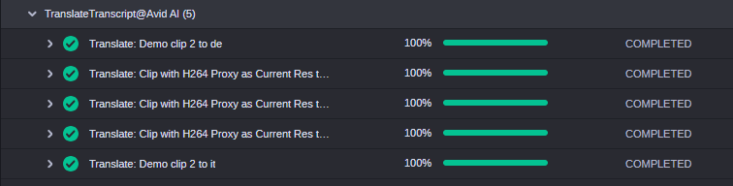
Each top-level Translate job shows the name of the asset for which the transcript translation is currently being created and a prefix (such as Translate or Avid AI Translation) in its name.
-
Click the Expand / Collapse toggle button in front of a top-level Translate job to show or hide its sub-jobs.
On the second hierarchy level, a Media Analytics<number> job for each partition is shown.
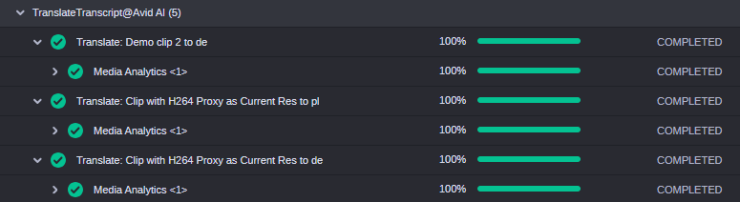
Below each Media Analytics partition job, the involved Media Analytics processor jobs are shown.
-
Click the Expand / Collapse toggle button in front of a parent job to show or hide its sub-jobs.
-
-
(optional) Apply additional filter criteria.
-
(Filters sidebar) To filter the jobs by creation time ranges, expand the Creation Time list and select one of the time ranges.
-
(Filters sidebar and Toolbar) To show only jobs of a specific life cycle, expand the Status list and select the Life cycle status you want to show or click the corresponding Status button in the toolbar. Multi-selection is supported.
-