Using the In-Line Hits Window
After you complete a search, the Results area allows you to access the In-Line Hits window in which you can review detailed information about the selected asset. These details are displayed in a side-by-side Metadata and Timeline view (tabs or panels). The app uses blue highlighting (up to a maximum of 4,000 hits) to identify terms that match your search criteria.
The Search app respects Asset Management CBA rules which might limit the number of fields or types of metadata that are available to some users.
In-Line Hits: Metadata View
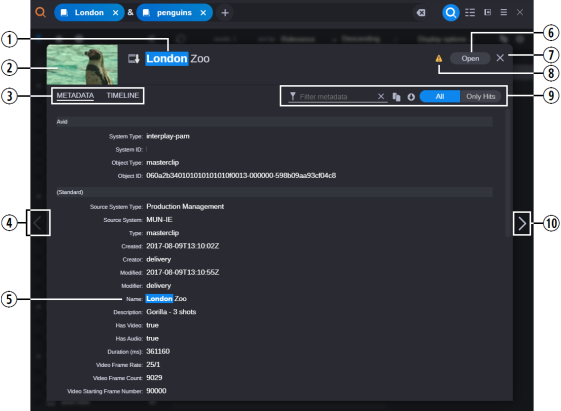
Similar to the content of the Metadata tab of the Asset Editor, the In-Line Hits window provides even more detailed information about the asset. The following illustration and table provide more information about this view.

|
|
Button |
Description |
|
1 |
Asset Name |
In this case, the asset name includes the search term and is therefore highlighted to indicate a match. |
|
2 |
Asset Thumbnail |
If your MediaCentral Cloud UX system is licensed for Hoverscrub, you can scrub the video from within the In-line Hits window. For more information, see Using the Hoverscrub Feature. |
|
3 |
Metadata / Timeline tabs |
If your web browser does not include enough space to display the entire In-Line Hits window, the information is presented in a tabbed view so that you can switch between the Metadata and Timeline panels. |
|
4 |
Previous Asset |
You can click this button to display the previous asset in your search results. If you are viewing the In-Line hits for the first (or only) asset in the results list, the button is disabled as shown in this illustration. |
|
5 |
Asset Metadata |
Displays the metadata that is associated with your selected asset — similar to the information presented in the Metadata tab of the Asset Editor. If your asset is associated with a compound attribute, such as an Asset Management thesaurus, the In-Line Hits window displays a preview of the first 100 entries. If the list is associated with more than 100 values, you must load the clip into the Asset Editor to view the entire metadata set. |
|
6 |
Open Button |
Click this button to open the asset in the Asset Editor. If the asset is associated with a specific app, that app is opened — for example a story is opened in the Rundown app, a session in the Log app, and so on. |
|
7 |
Close Button |
Click this button to close the In-Line Hits window. |
|
8 |
Asset Unavailable |
If the source MediaCentral module is unavailable for any reason, a warning appears to alert you to the situation. In this case, you will not be able to click the Open button to load the asset. |
|
9 |
Hits Toolbar |
This toolbar includes a row of buttons that allow you to work with the asset and the In-Line Hits window.
Described from left to right:
|
|
10 |
Next Asset |
You can click this button to display the next asset in your search results. If you are viewing the In-Line hits for the last (or only) asset in the results list, the button is disabled. |
n If you enable the Auto-Refresh option in the Results area of the Search app and the asset that you are currently viewing in the In-Line Hits window is removed from the results list after the refresh, the window closes automatically and it is replaced with a new window that displays the following message: "The asset you were previewing is no longer available in search results. The asset might not match the query anymore, or the asset may have been deleted."
In-Line Hits: Timeline View
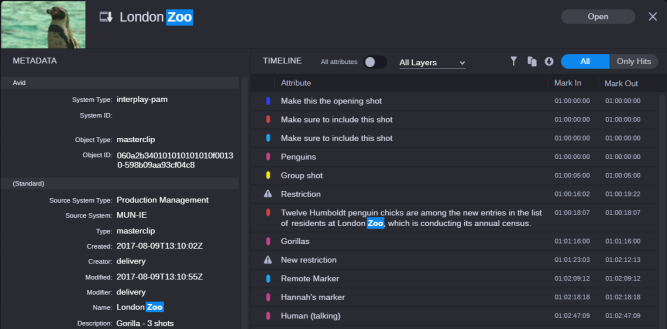
The Timeline panel displays all time-based metadata such as markers and segments in a list view that is organized by the asset’s timecode. Depending on your system configuration and license, the Timeline might also show transcript data from Avid Transcribe, or phonetic hits from MediaCentral Phonetic Index. If your asset does not include any time-based metadata, the Timeline view displays a message to alert you of this condition.
Phonetic hits include not only a timecode reference, but also a percentage meter that rates the confidence level of the hit being a match for your search.

The following illustration shows the Timeline panel to the right of the Metadata area. In this example, the web browser window is large enough to allow both areas to be displayed simultaneously.

You can double-click on any of the rows in the Timeline view to load the asset into the Asset Editor and advance to the selected metadata, transcript, or phonetic hit. If you select the appropriate tab in the Asset Editor (Hits, Storyboard, or Transcript), the tab highlights your selected hit.
Displaying Layer Details
The All Attributes toggle at the top of the Timeline panel allows you to display the Marker or Segment metadata in either full sized (default) or minimized rows.
Full Size Rows
When the All Attributes toggle is enabled (blue), the app displays all attributes of a layer segment, as shown in the following illustration.

The bar at the top of the row shows the relative position of the hit in the selected asset, as well as the timecode location to the right of the bar. Segments display a timecode span, while markers have identical In and Out marks.
Minimized Row Details
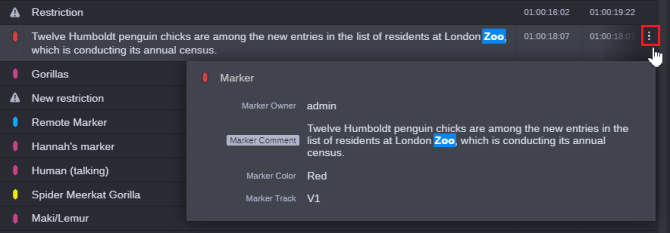
 If you disable the All Attributes toggle, the app displays a limited amount of information. This option might be preferable if you have an asset with a large amount of marker and segment data. You can obtain more information about any hit by clicking the context menu button to the far right of the associated row.

In this illustration, the Marker details panel displays information on the Owner, Comment, Color, and Track. If you click on any of these metadata fields, the Timeline view updates to organize the hits by the field that you selected. The Timeline view maintains this look until you either select a different metadata field or change the filter options in the In-Line Hits window.
If you hover over any of the rows in the Timeline view, a number might appear to the far right of the row. This value indicates that the hit is associated with additional matches for your search. In the following example, the Timeline panel shows a match for “blue” and that there is +1 match that is not displayed.

If you click the context menu button or the additional hits button (+1 in this case), the app displays the marker details panel. In this example, the second match is against the marker color — also blue.
Displaying Layer Names
The Timeline panel displays a layer icon on the far left of each row of information. Hidden by default, the Search app includes an accompanying text label for each row. Depending on your preference, you to toggle this text field on or off. The following illustration shows an Asset Management asset with the labels enabled.

To show or hide the layer name:
-
Right click on the icon and select either Show Stratum Name or Hide Stratum Name.
The system remembers your last selection for future sessions. If you hide the labels, you can still hover your cursor over the icon to display the label as a tool-tip.
Using the Layers Filter
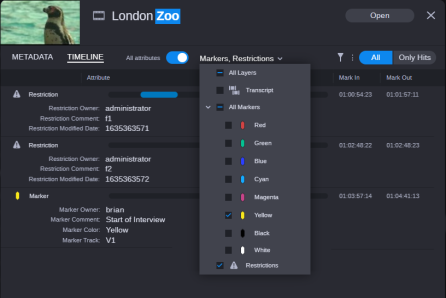
Located to the right of the All Attributes button, the Layers filter allows you to display All Layers (by default) or display one or more individual layers of data. In the following illustration, the user enabled the Yellow marker layer and the Restrictions layer on a Production Management asset.

If your asset does not include any layer data, the Layers filter is not displayed. If your asset does not include a layer type, such as Restrictions, that layer is not displayed in the menu.
To toggle the layers display:
-
Click the Layers menu to display a list of options.
-
Do one of the following:
-
Click the box to the left of any layer name to enable it.
A check mark appears in the box to indicate that the layer is selected. Any layer without a check mark is hidden from view.
-
Click an enabled layer to hide that layer from view.
-
If your asset includes multiple layer types, you can click the All Layers box to display all layers.
This option clears the check mark from any layer that you might have manually selected. If your asset includes only one type of layer, such as Markers only, this option might not be available.
The Inline Hits window is updated immediately after selecting or deselecting a layer.
-
-
Click anywhere else in the user interface to dismiss the menu.
Opening the In-Line Hits Window
To access the in-line hits view:
-
Use the Search app to find your desired asset or assets.
-
Move your cursor to the far-right of the row that represents your asset in the Details area.
As shown in the following illustration, an Asset Inspection icon appears in the row for that asset.

List view shown. When in Card view, the icon appears in the bottom-right corner of the card.
-
Click the Asset Inspection button to show the In-line Hits window.
Adding Markers & Segments to a Sequence
Similar to the workflow available in the Asset Editor’s Storyboard tab, the Timeline view of the In-Line Hits window allows you to drag Asset Management segments or Production Management Markers and Restrictions directly to the sequence timeline to help you expedite the editing process.
n When you add a Production Management marker, the drag and drop operation creates a four second segment that consists of 2 seconds before and after the marker.
For additional information on the Storyboard workflow, see Adding Storyboard Items to a Sequence.
To add timeline hits to a sequence:
-
Locate an asset through the Search app and open the Timeline view of the In-Line Hits window.
-
Open the sequence that you want to edit.
-
Click the Asset Editor Timeline button to display the Sequence Timeline.
-
Click the Asset Editor Source/Record Monitor toggle button to switch Asset Editor to Source mode.
-
Click and drag the marker, restriction, or segment from the Timeline view of the In-Line Hits window to a point in the Sequence Timeline.
As a reminder, make sure to save your sequence when your edit session is complete.

 If you decrease the size of your browser, the buttons might be moved into context menu. You can click this menu to access these features. If you select the Timeline View, the Layers filter also appears in this menu.